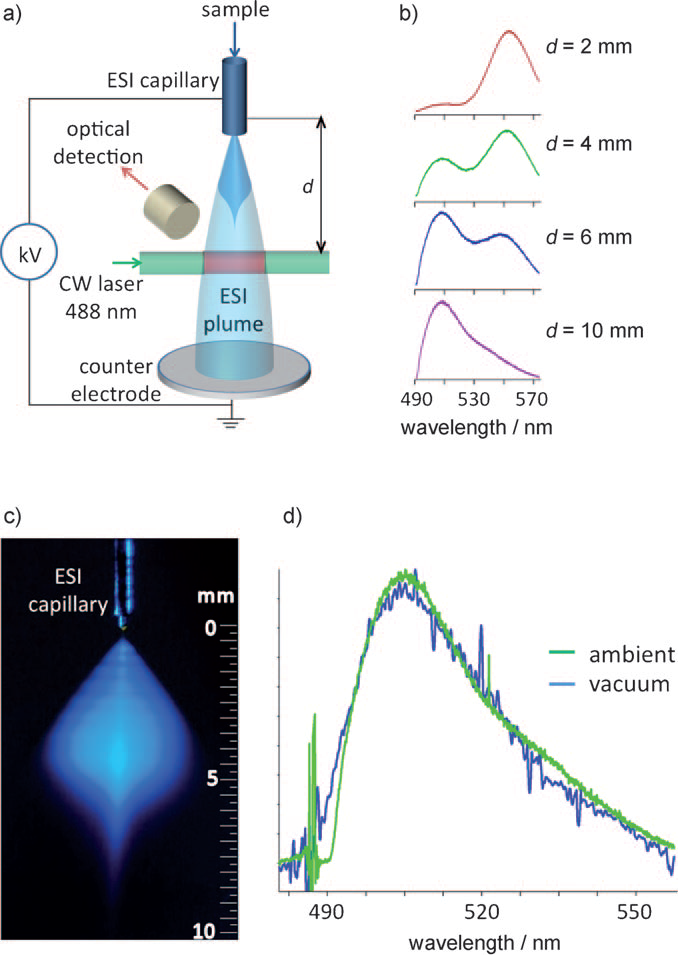
Figure 1. a) Experimental setup for optical spectroscopy in an ESI plume. b) Fluorescence spectra obtained from different regions in the ESI plume when a solution of R6G in methanol was electrosprayed.c) A photograph of the upper region of the ESI plume that was taken when the excitation laser beam was unfocused so that the whole plume area was illuminated; the blue color is due to laser light scattering from droplets in the plume. d) Fluorescence spectra of R6G ions recorded by FTICR MS–LIF spectroscopy (blue) and in the ESI plume in (b), bottom (green).
![]() 2010-Konstantin Chingin-Angew. Chem. Int. Ed.pdf
2010-Konstantin Chingin-Angew. Chem. Int. Ed.pdf
